DevTools 2.8.0 release notes
The 2.8.0 release of the Dart and Flutter DevTools includes the following changes among other general improvements. To learn more about DevTools, check out the DevTools overview.
General updates
#Improvements for initial page load time - #3325
Performance improvements for connecting DevTools to a device, particularly impactful for low-memory devices - #3468
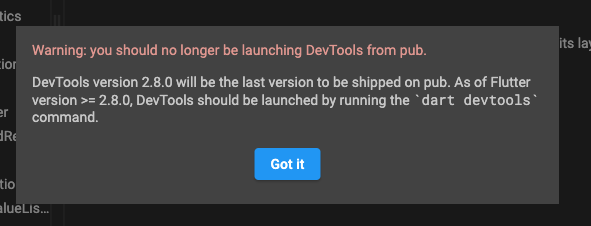
For users on Flutter 2.8.0 or greater (or Dart 2.15.0 or greater), DevTools should now be launched via the
dart devtoolscommand instead of runningpub global activate devtools. DevTools 2.8.0 will be the last version of DevTools shipped on pub, and all future versions of DevTools will be shipped as part of the Dart SDK. If you see this warning, be sure to open DevTools viadart devtoolsinstead of from pub:
Performance updates
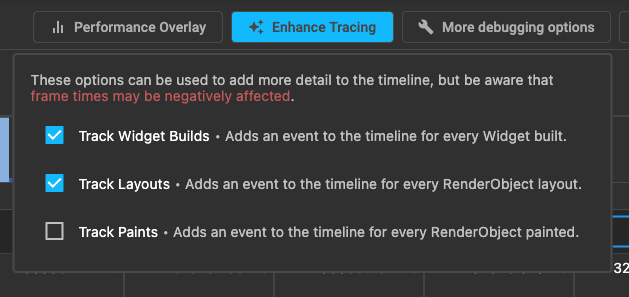
#Added a new "Enhance Tracing" feature to help users diagnose UI jank stemming from expensive Build, Layout, and Paint operations.

The expected workflow is as such:
- User is investigating UI jank in the performance page
- User notices a long Build, Layout, and/or Paint event
- User turns on the respective tracking toggle in the "Enhance Tracing" feature
- User reproduces the UI jank in their app
- User looks at the new set of Timeline events, which should now have additional child events for widgets built, render objects laid out, and/or render objects painted

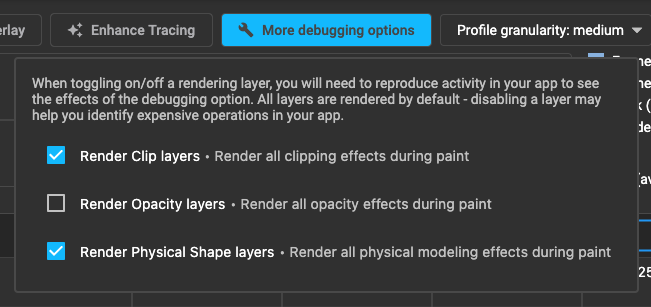
Added new "More debugging options" feature to allow for disabling rendering layers for Clip, Opacity, and Physical Shapes.

The expected workflow is as such:
- User is investigating UI jank in the performance page
- User notices a lot of janky frames and suspects it could be due to excessive use of clipping, opacity, or physical shapes.
- User turns off the respective render layer toggle in the "More debugging options" feature
- User reproduces the UI jank in their app
- If the UI jank is reduced with a rendering layer turned off, the user should try to optimize their app to use less clipping/opacity/physical shape effects. If the UI jank is not reduced, the user now knows that the performance problem is not due to these UI effects.
Debugger updates
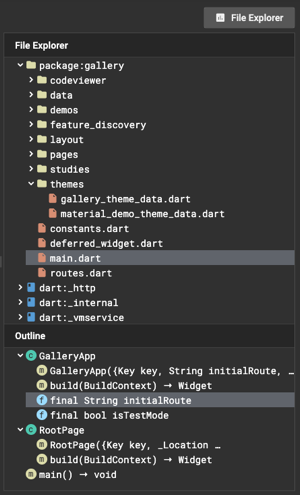
#Replaced the "Libraries" pane with a "File Explorer" pane - #3448. The "File Explorer" pane has two components:
- A tree view of the libraries present in your application. You can use the File Explorer to find and open a library, or you can use the existing Ctrl / Cmd + P keyboard shortcut to search for a file.
- A new "Outline" view that shows the structure of the selected library. This view will show classes, members, methods, etc., and when an item is selected, the source view will jump to the respective line of code for the selected item.

Performance improvements to expression evaluation auto complete - #3463
Fixed a bug with keyboard shortcuts - #3458
Full commit history
#To find a complete list of changes since the previous release, check out the diff on GitHub.
Unless stated otherwise, the documentation on this site reflects the latest stable version of Flutter. Page last updated on 2024-04-04. View source or report an issue.